Quality Control of Edible Oils by NMR Spectroscopy
A topic which fits perfectly into this topic is our research on “Holistic control of edible oils based on NMR spectroscopy” which will be presented on 20 September 2018 in the morning at 09:26-09:50 by Elina Zailer. Elina will present the NMR spectroscopy as an alternative to all the conventional methods such as titration and chromatography. 1H NMR spectroscopy is a powerful tool for the determination of the quality parameters such as iodine value, peroxide value, anisidine value, free fatty acids and further substances such as sterols, tocopherols, or squalene in olive oil (Fig. 1).
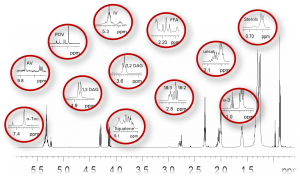
Fig. 1 1H NMR spectrum of an olive oil; details: relevant signals with the appropriate assignment
Fatty Acid Composition by 1H and 13C NMR Spectroscopy
Furthermore, the 1H NMR spectrum ensures a high level of information on the fatty acid profile. Saturated, monounsaturated and multi-unsaturated fatty acids as well as omega-3, C18:2 and C18:3 fatty acids can be distinguished (Fig. 2). Based on the fatty acid composition the type of edible oil can be determined. Unsaturated fatty acids account for the molar majority of the fatty acids – in all edible oils they amount 78-93 mol-%. Comparing now the ratio of monounsaturated fatty acids, C18:2, C18:3 and total omega-3 fatty acids, the type of edible oil can be determined.

Fig. 2 Fatty Acid composition of several vegetable oils
Are more information concerning the fatty acid profile and the regioselective distribution required, a 13C NMR spectroscopic analysis is performed. Here, mono- (MAG), di- (DAG) and triacylglycerides (TAG) are identified and quantified. Going more into detail, the position of the individual fatty acid in the sn-1/3 and sn-2 position is determined. But what does “sn” mean? “sn” is the position of the glycerol backbone. “sn-1/3” are the outer positions with the bonded fatty acids R1 and R3, and “sn-2” is the inner position with R2. As presented in Fig. 3 the composition of fatty acids in the inner and outer position of the glycerol backbone is completely different. Saturated fatty acids can only be found in the outer (sn-1/3) positions, whereas unsaturated fatty acids are bonded in all three positions.
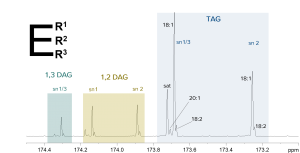
Fig. 3 13C NMR spectrum of the regioselective distribution of fatty acids in the sn-position
DHA and EPA as Specific Fatty Acids
Looking in fish and krill oil, very specific fatty acids such as Docosahexaenoic acid (DHA) and Eicosapentaenoic acid (EPA) are present. By the chemical shift of the respective signals, we can distinguish whether the TAG consists of one, two or three DHA fatty acids (Fig. 4). We will answer the question how to use all these information and how to confirm the authenticity of the sample concerning contaminations and frauds how e did in our heparin analysis.
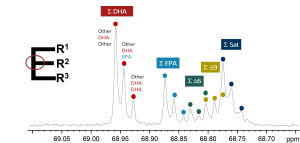
Fig. 4 13C NMR spectrum of the regioselective distribution of DHA and EPA in the sn-position